Why Local SEO matters
Local search queries often lead directly to concrete actions.
Users compare businesses, check reviews, and frequently make decisions within a very short time.
This page summarizes key statistics regarding Local SEO.
All figures are sourced from independent studies and are linked directly to their original sources.
The data covers the following areas:
- Local Search Behavior
- Google Maps and Local Pack
- Click-Through Rate by Position
- Online Reviews
- Mobile and Voice Search
- Purchase Decisions for Local Providers
Local Search Behavior
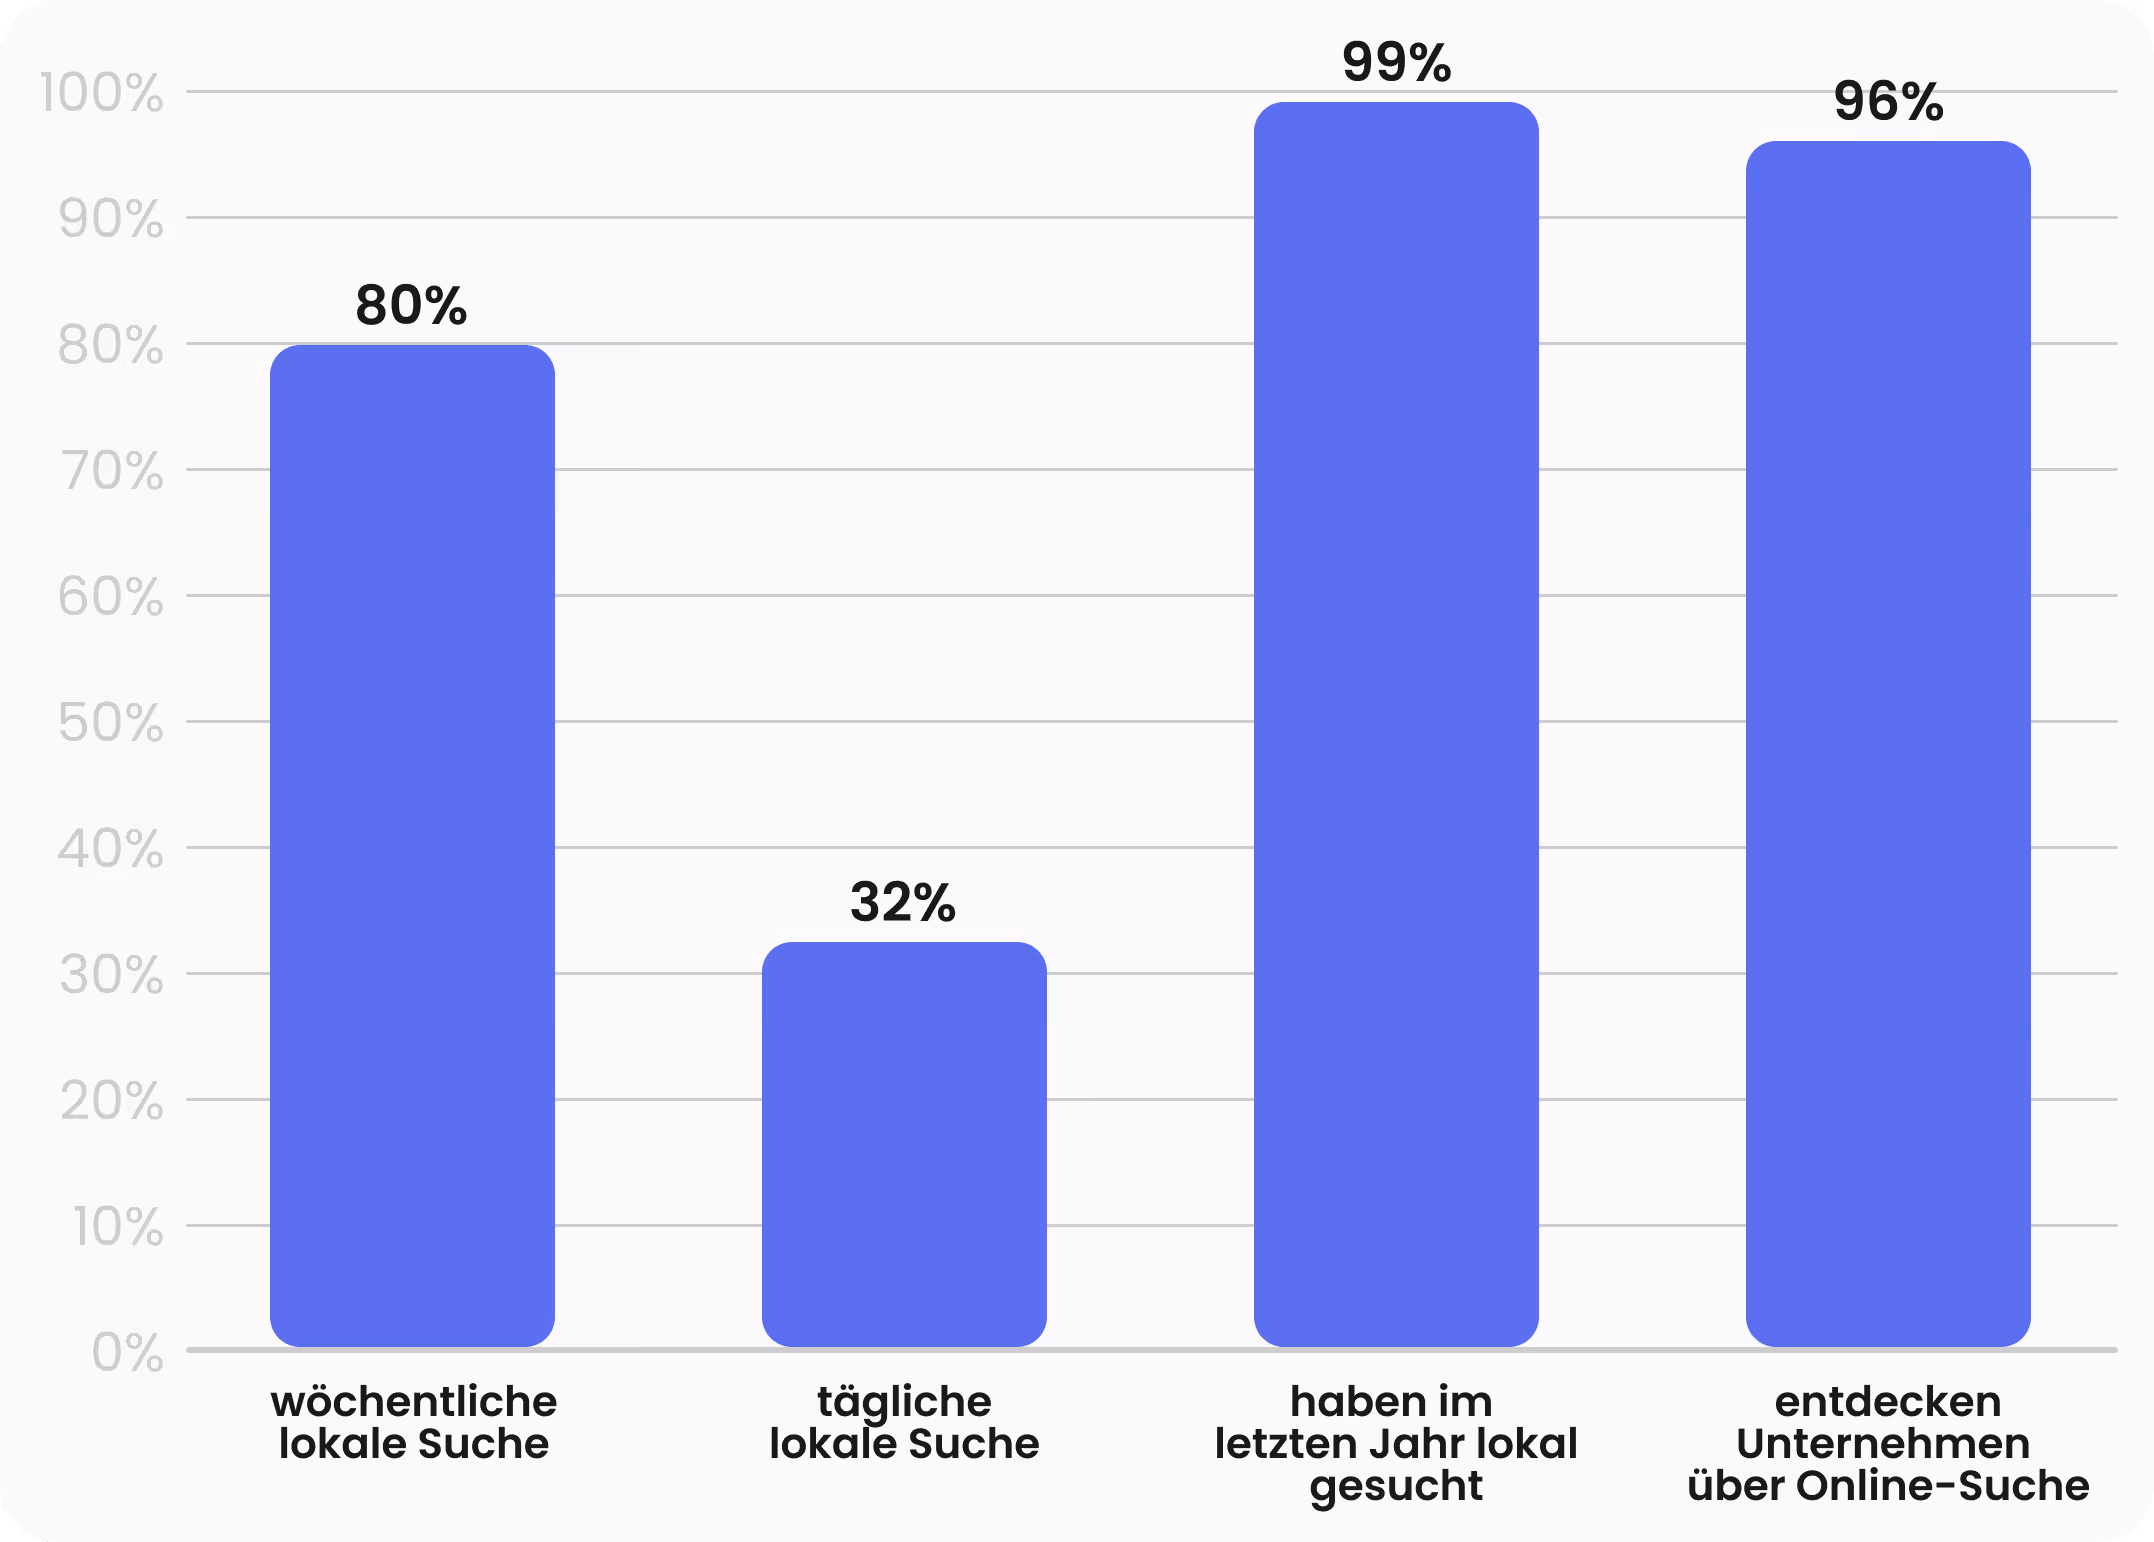
1) 80 % of consumers search online for local businesses at least once a week.. (BrightLocal)
2) 32 % of users perform local searches daily. (BrightLocal)
3) 99 % of people have searched online for local businesses in the last year. (SeoProfy)
4) 96 % of consumers discover local businesses through online searches. (SeoProfy)
5)Local search queries often carry a concrete intent to purchase or contact. (Ryse Visibility)
“Near Me” Searches & Intent
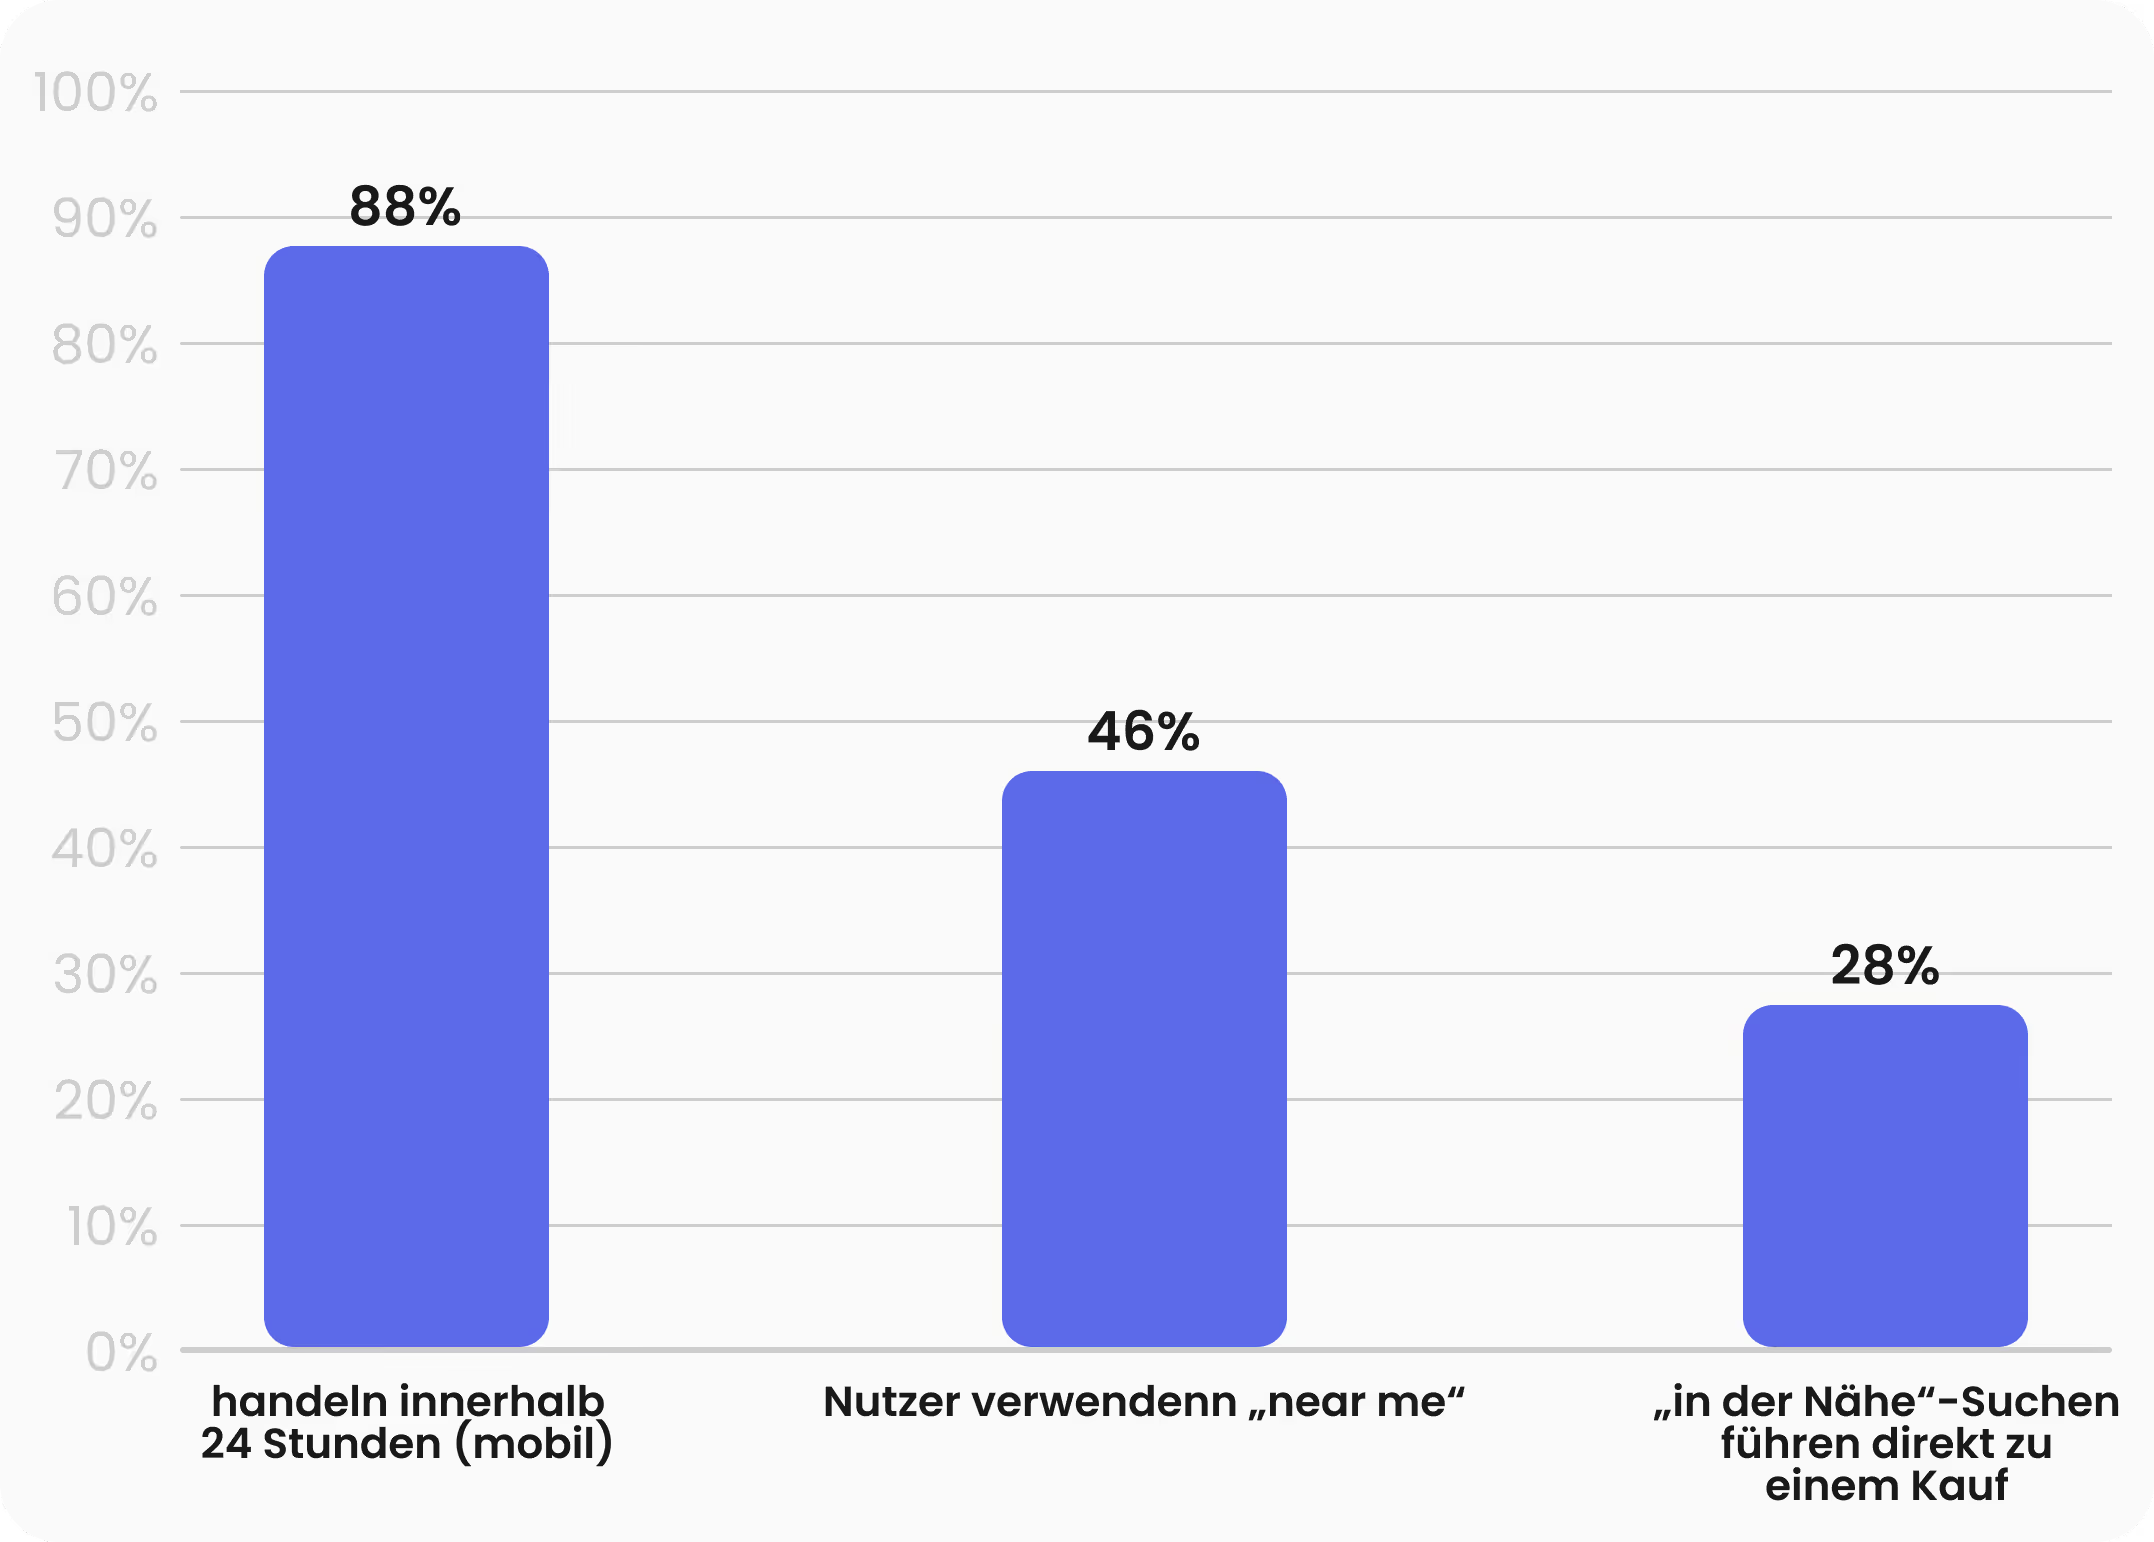
6) 88 % of mobile local searches lead to a visit or call within 24 hours. (Synup)
7) 46 % of users add “near me” to their search queries. (SeoProfy)
8) “Near me” searches have increased by several hundred percent in recent years. (WebFX)
9) “Near me” searches show a particularly high conversion probability. (Red Local Agency)
10) 28 % of “near me” searches result directly in a purchase. (WebFX)
Google Maps & Local Pack
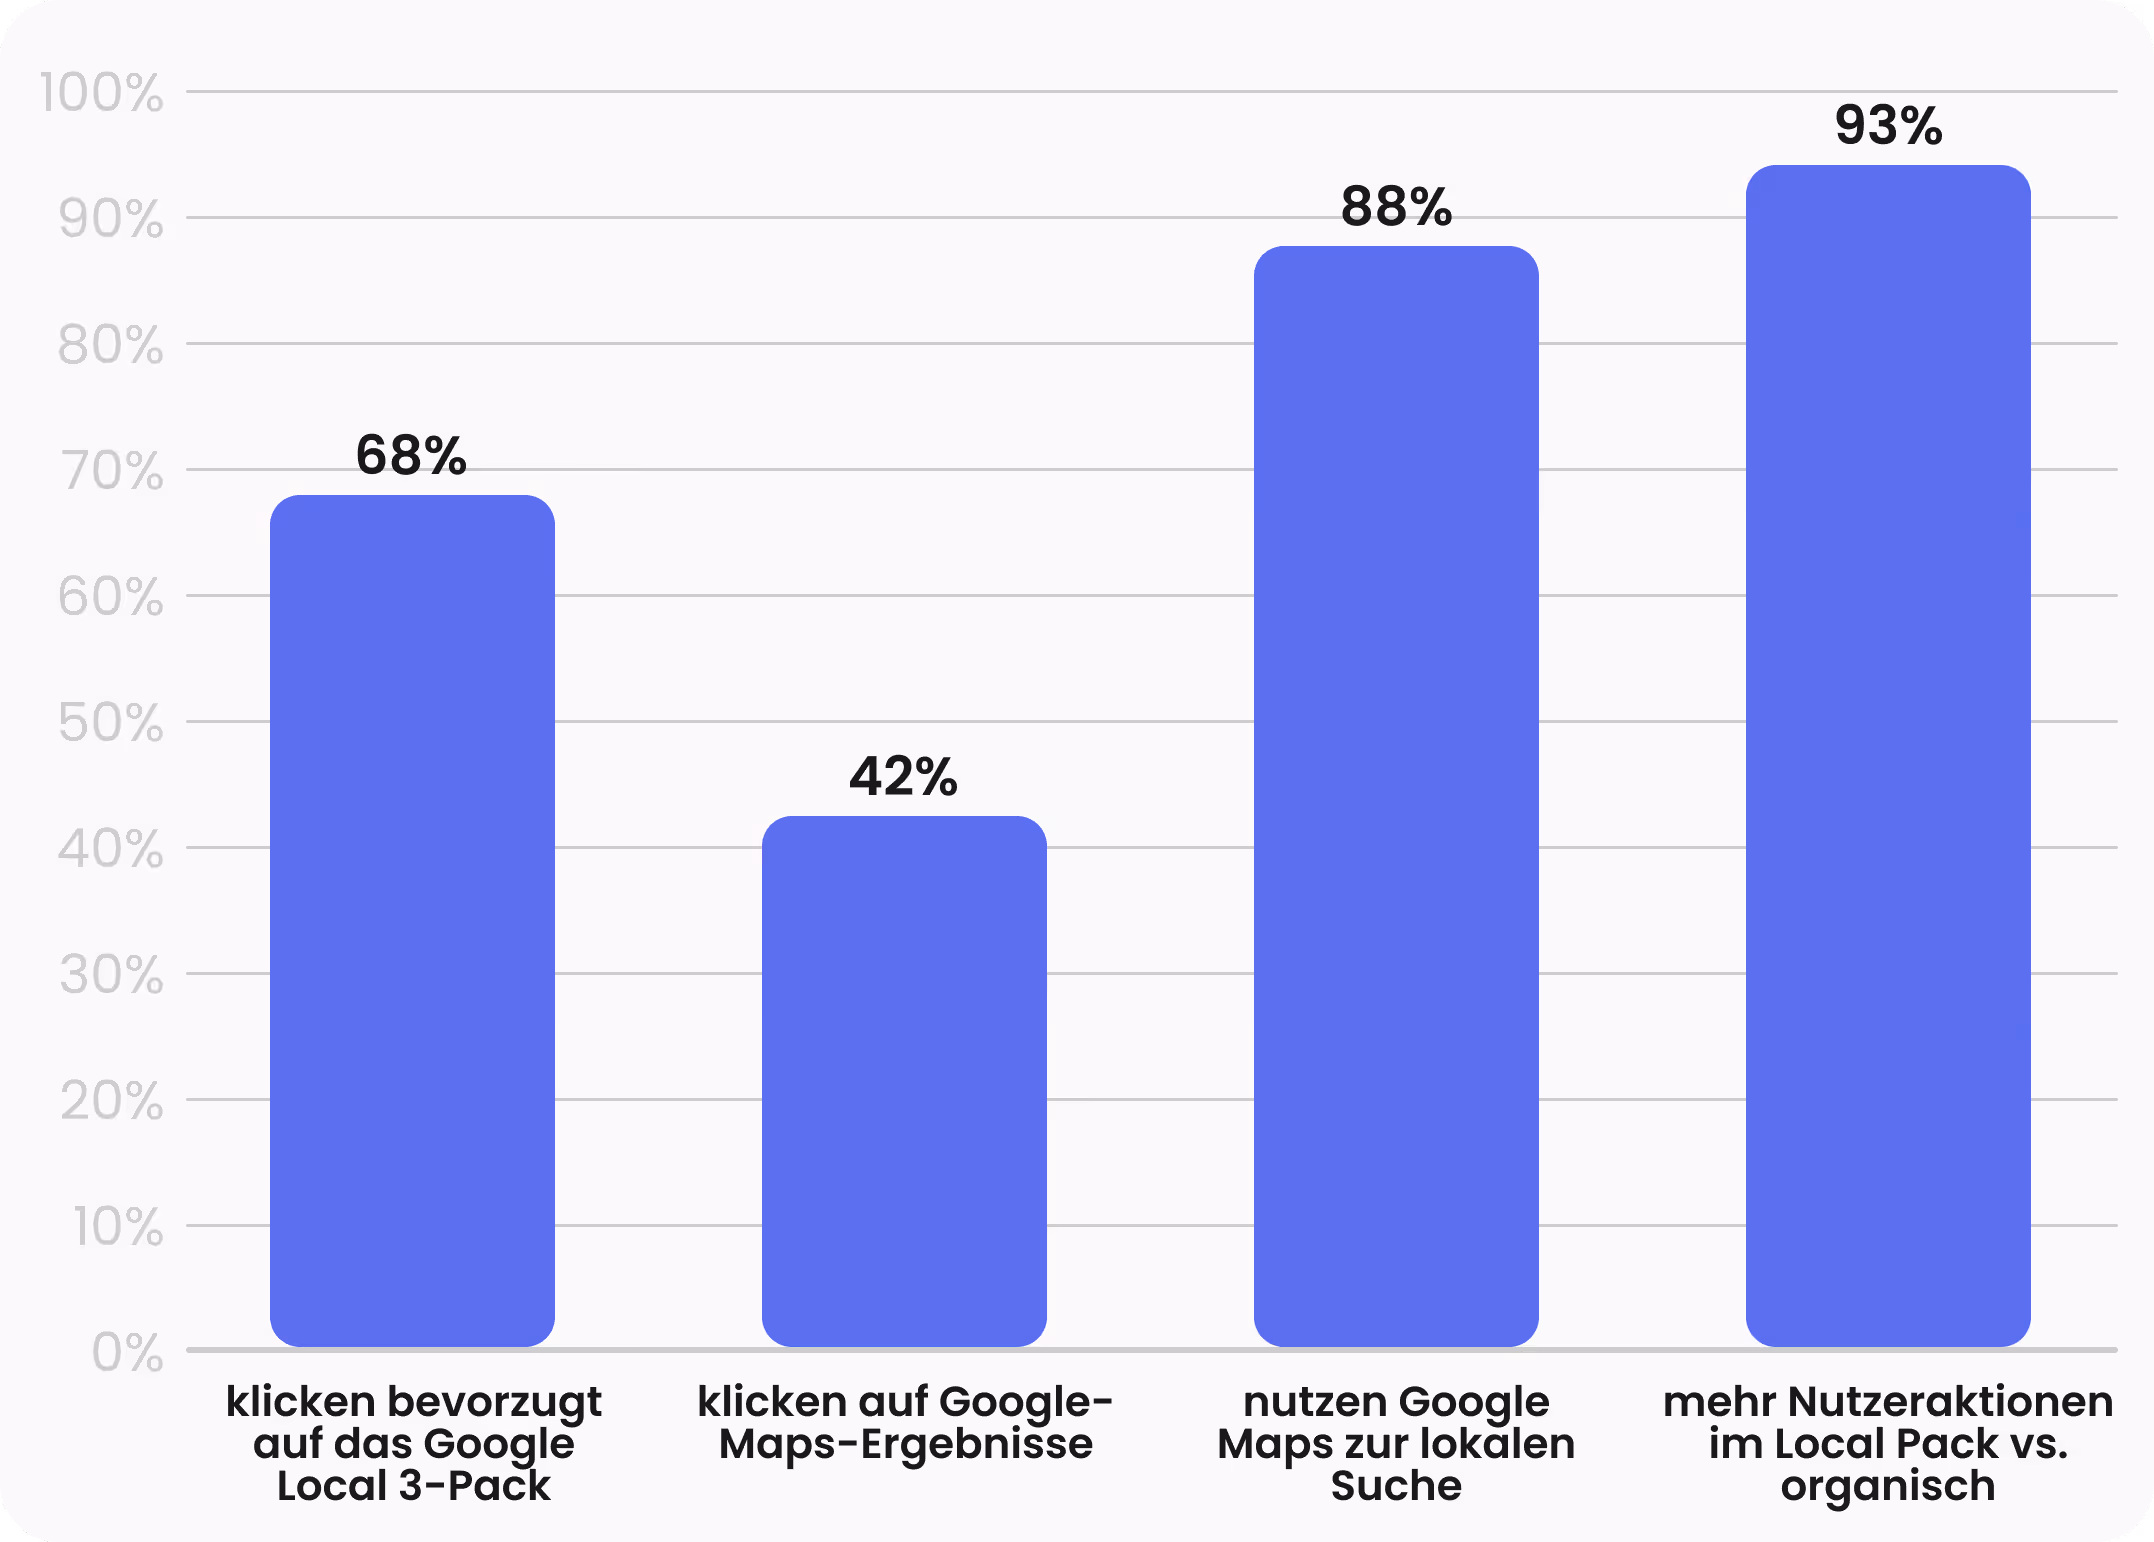
11) 68 of users prefer to click on results in the Google Local 3-Pack. (Red Local Agency)
12) 42 % of local searchers click on Google Maps results. (SeoProfy)
13) 88 % of consumers use Google Maps to find local businesses. (SeoProfy)
14) Businesses in the Local 3-Pack achieve up to 93% more user actions than regular organic results. (SeoProfy)
15) Businesses outside the Local Pack lose a major portion of their local visibility. (On The Map)
Click-Through Rate (CTR) & Rankings
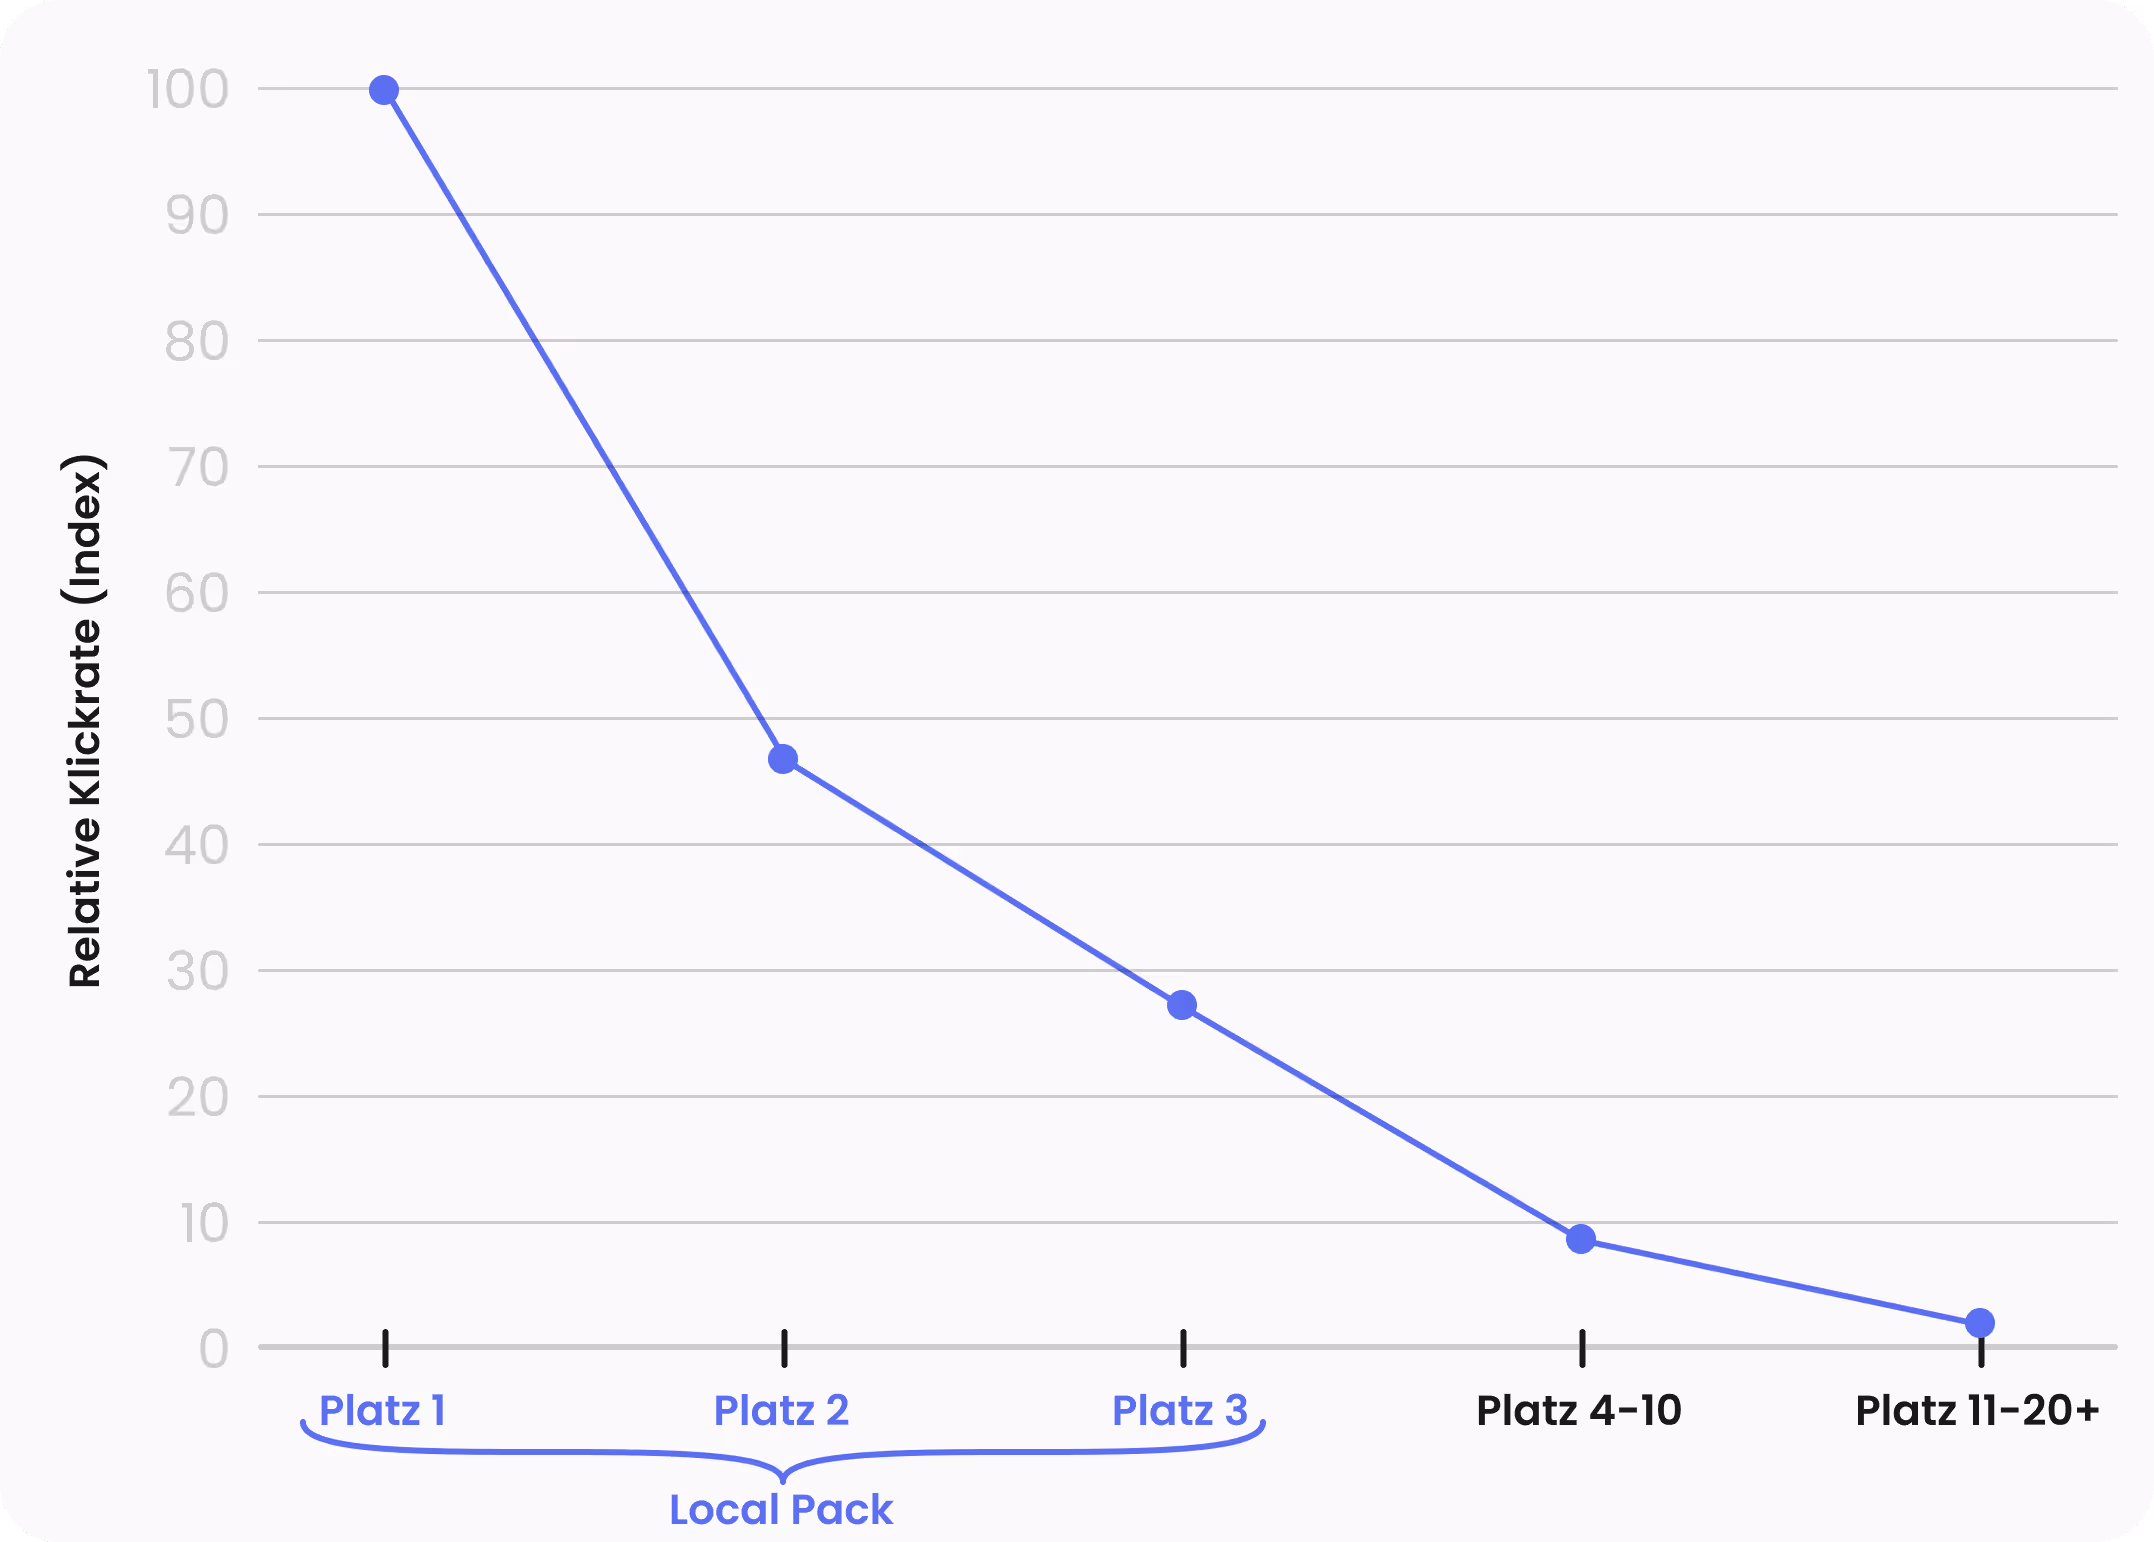
Relative click rate by ranking position
16) Position 1 on Google achieves the highest click-through rate. (First Page Sage)
17) The click-through rate drops significantly below the top 3 positions. (First Page Sage)
18) Organic search results achieve higher click-through rates than Google Ads. (Backlinko)
19) Local results are clicked more often than general organic results. (SeoDesignChicago)
Online Reviews & Trust
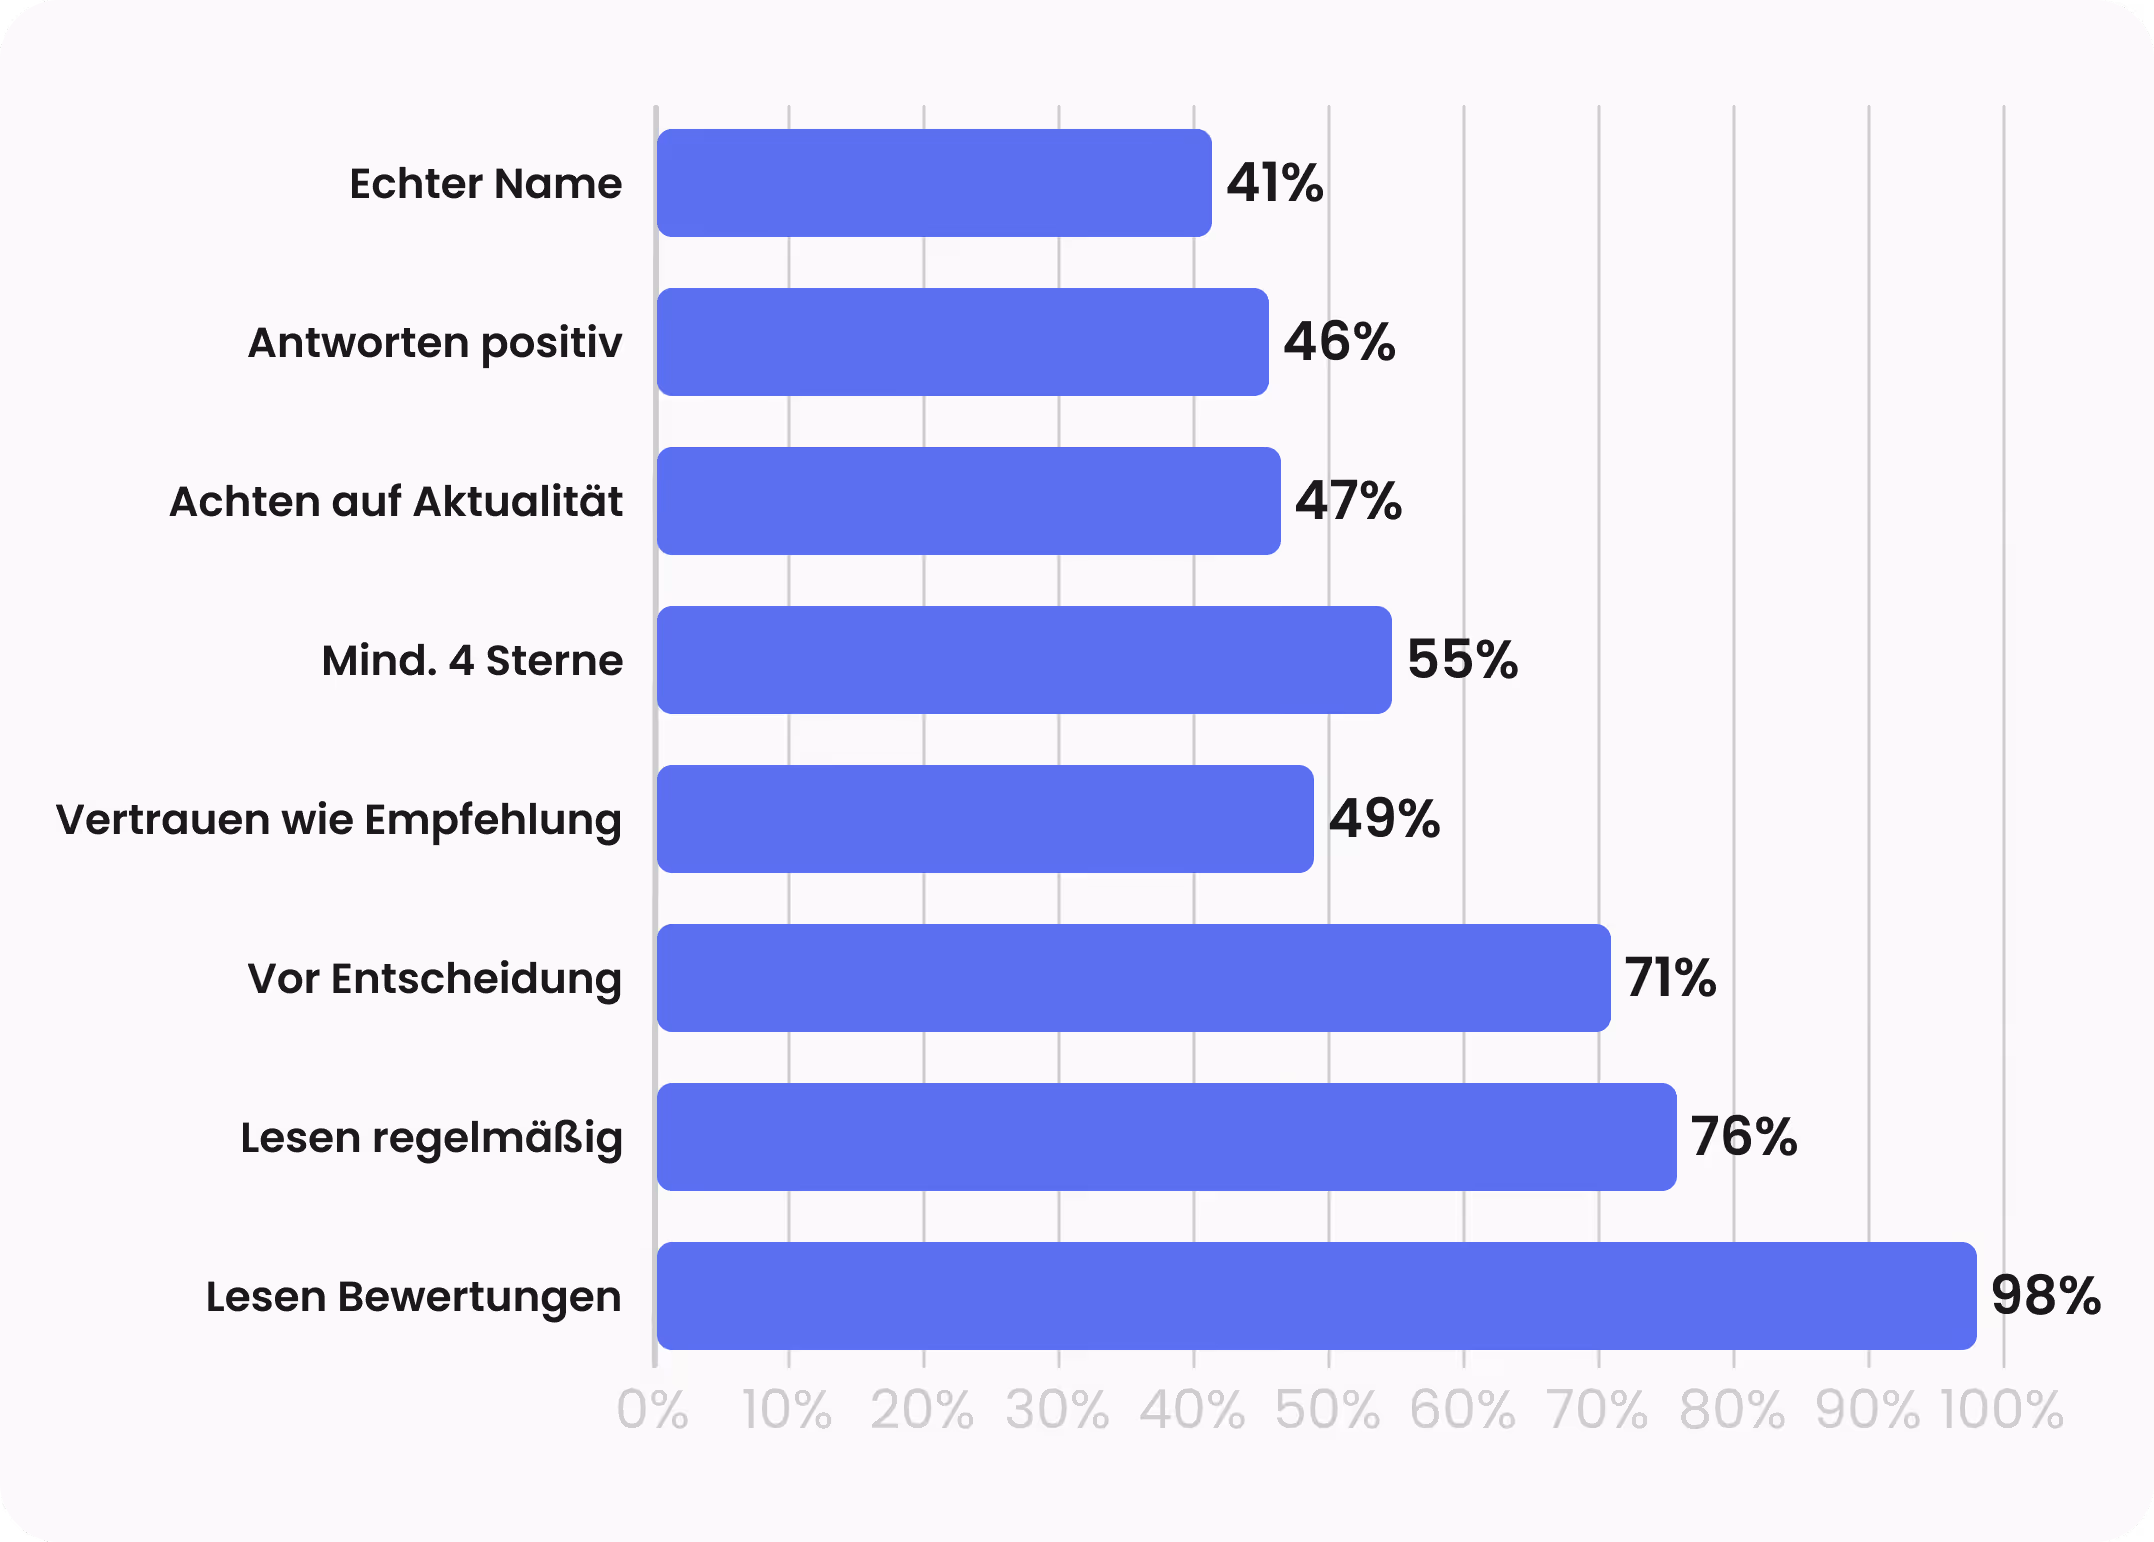
20) 98 % of consumers read online reviews for local businesses. (BrightLocal)
21) 76 % of users read reviews regularly or always. (BrightLocal)
22) 71 % of consumers read reviews before choosing a local business. (BrightLocal)
23) 49 % of consumers trust online reviews as much as personal recommendations. (BrightLocal)
24) 55 % of users only consider businesses with at least 4 stars. (BrightLocal)
25) 47 % pay close attention to recent reviews. (BrightLocal)
26) 46 % view it positively when businesses respond to reviews. (BrightLocal)
27) 41 % prefer reviews with real names. (BrightLocal)
Reviews & Purchase Decisions
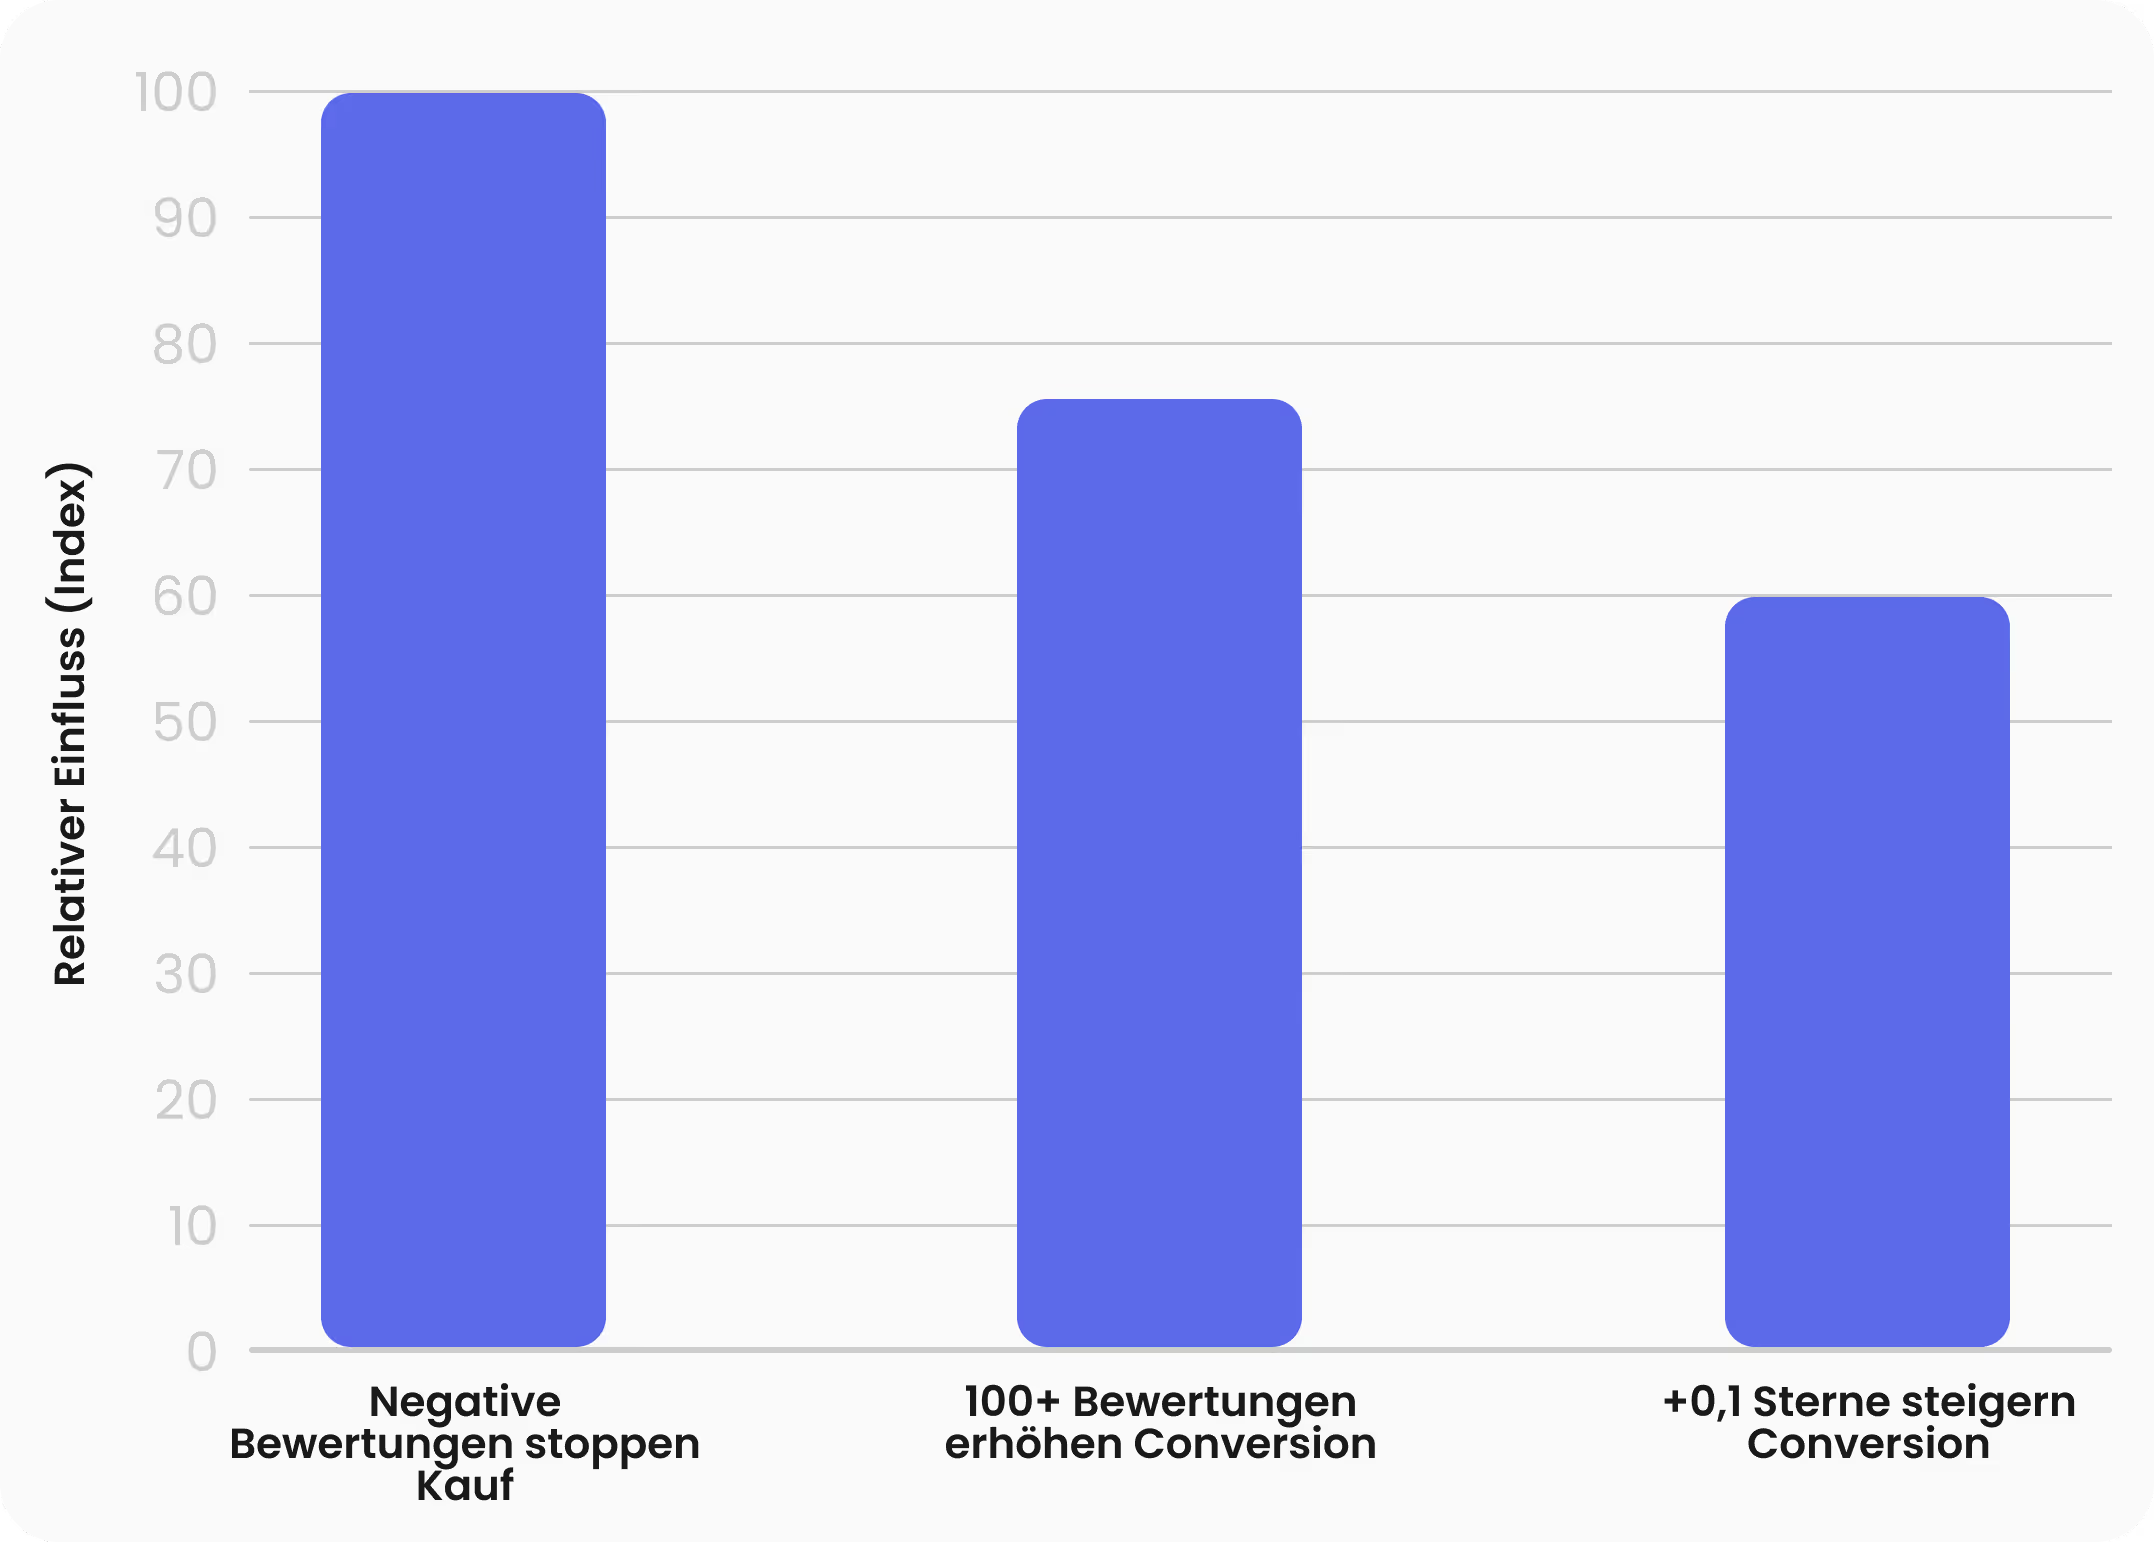
Visualized as a relative index showing the impact of reviews on purchase decisions, based on data from Statista and BrightLocal.
28) The majority of buyers read reviews before making a purchase decision. (Statista)
29) Negative reviews can completely deter users from a decision. (Statista)
30) A 0.1 star improvement can increase the conversion rate by up to 25%. (BrightLocal)
31) Businesses with more than 100 reviews achieve significantly higher conversion rates. (BrightLocal)
Google Business Profile
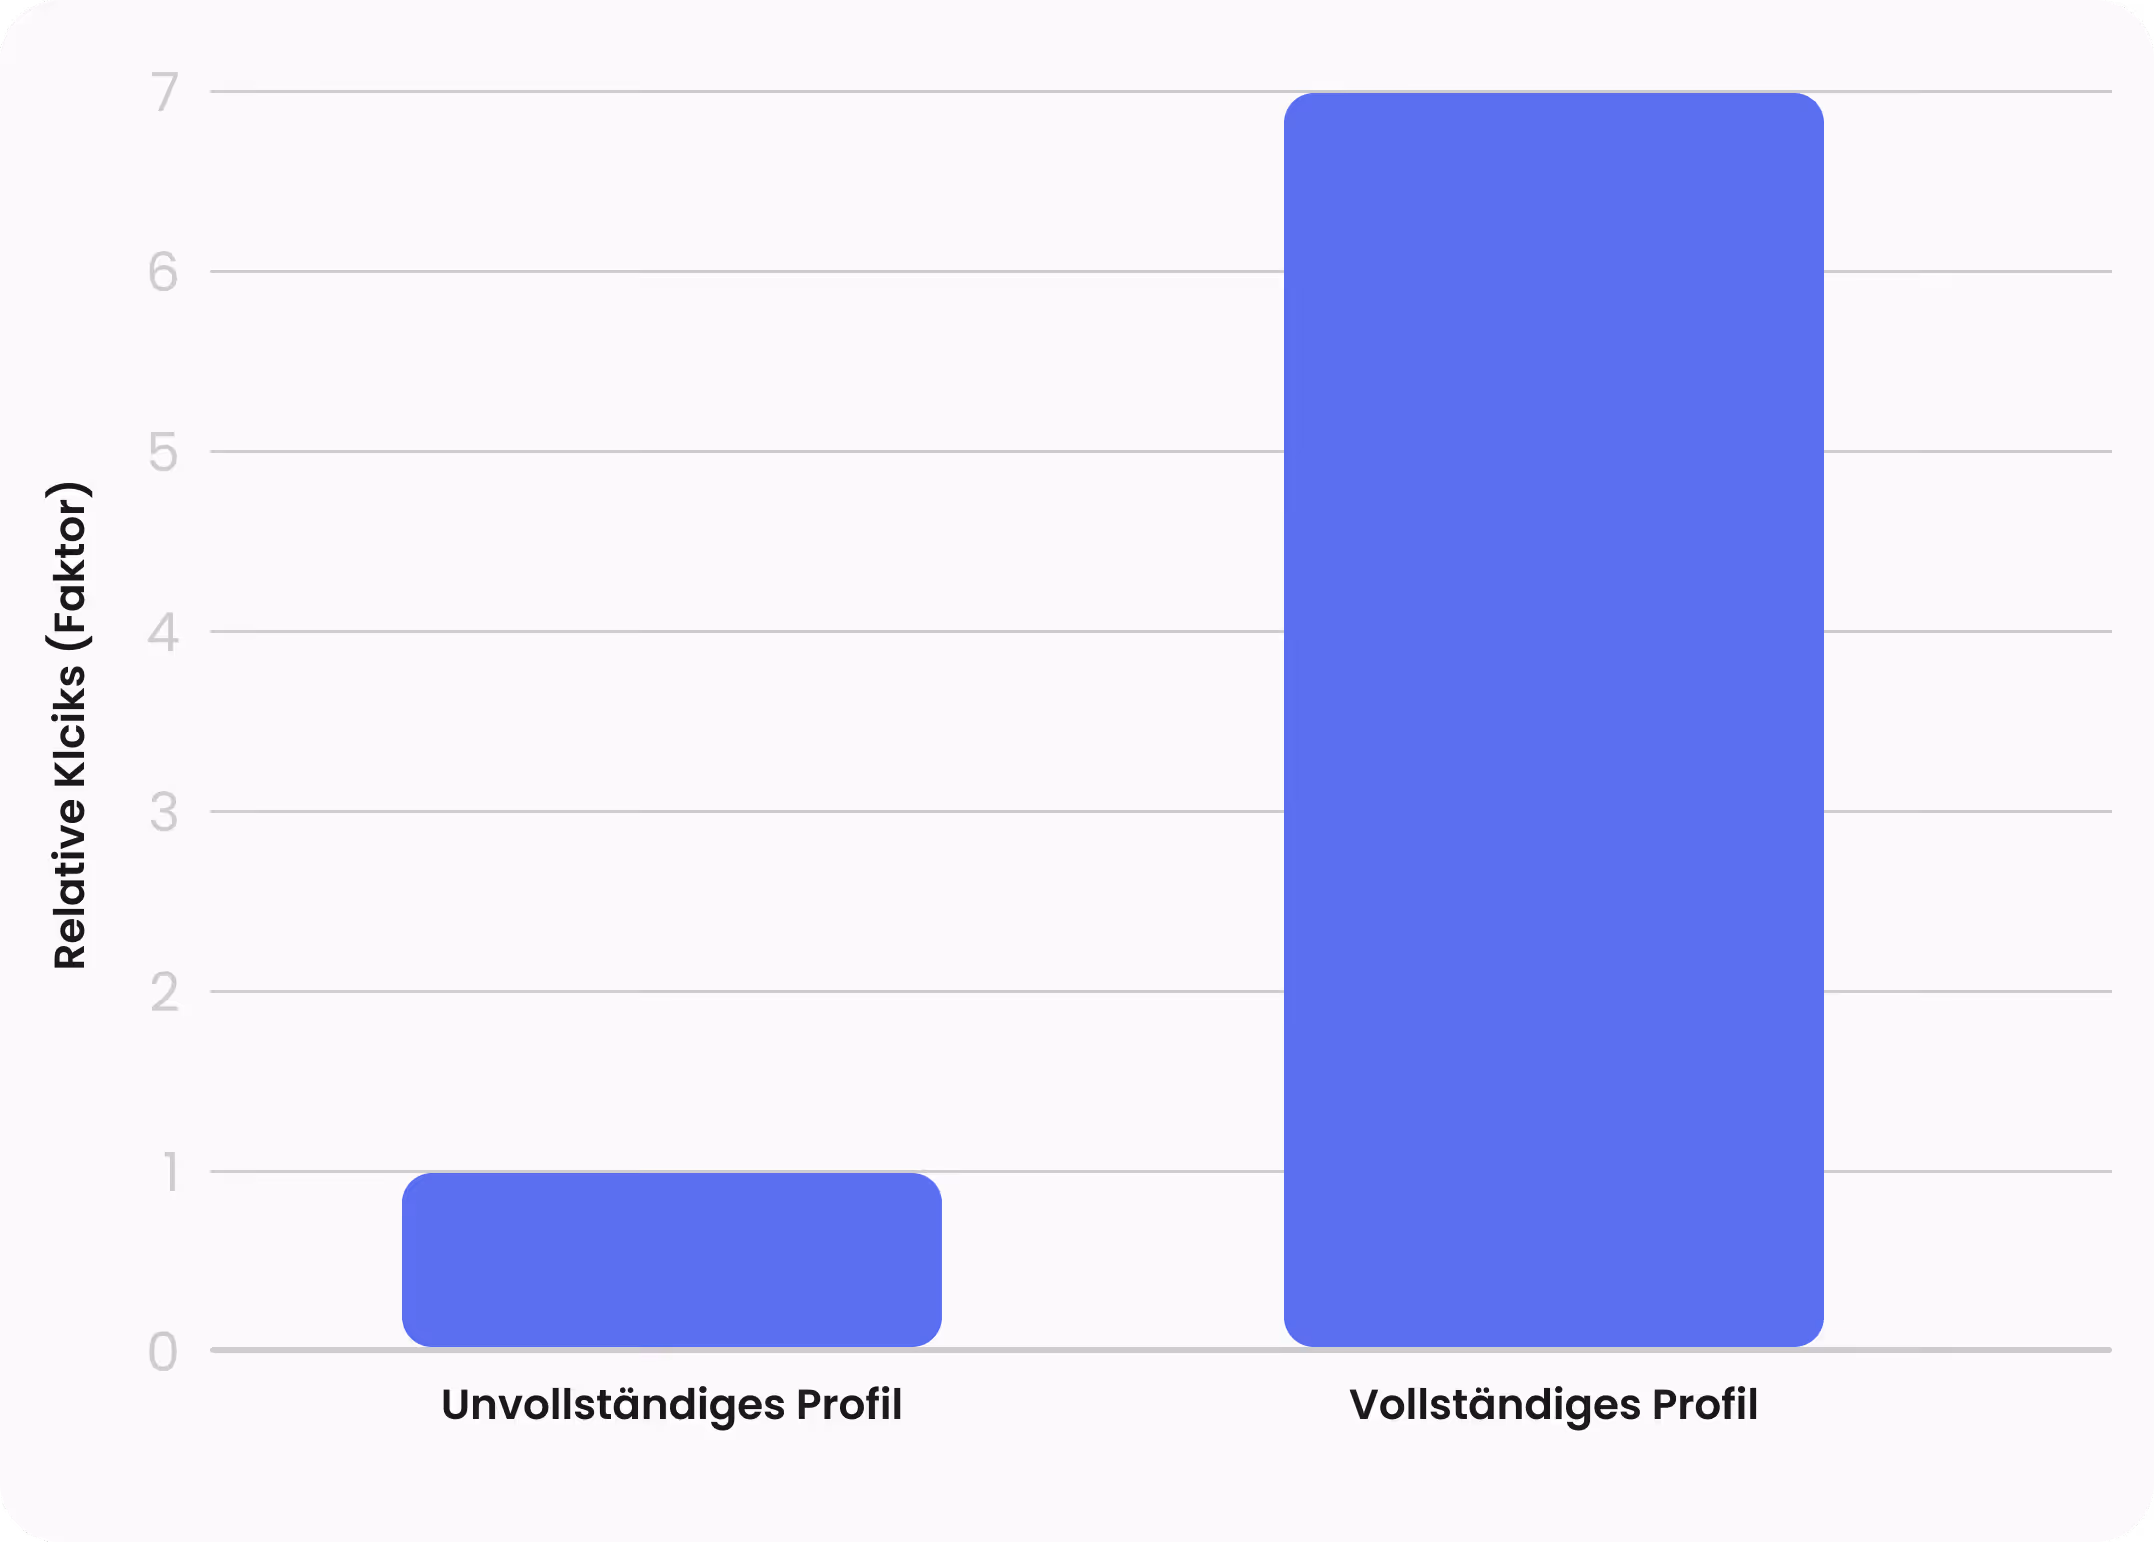
32) Businesses with a complete Google Business Profile receive up to 7 times more clicks. (Publer)
33) 45 % of businesses receive appointment or booking requests via their Google Business Profile. (SeoProfy)
34) Complete business profiles are perceived as 2.7 times more trustworthy. (SeoProfy)
35) 62 % of consumers avoid businesses with incorrect online information. (SeoProfy)
36) Google Business Profiles generate over 1,200 views per month on average. (WebFX)
Mobile & Voice Search
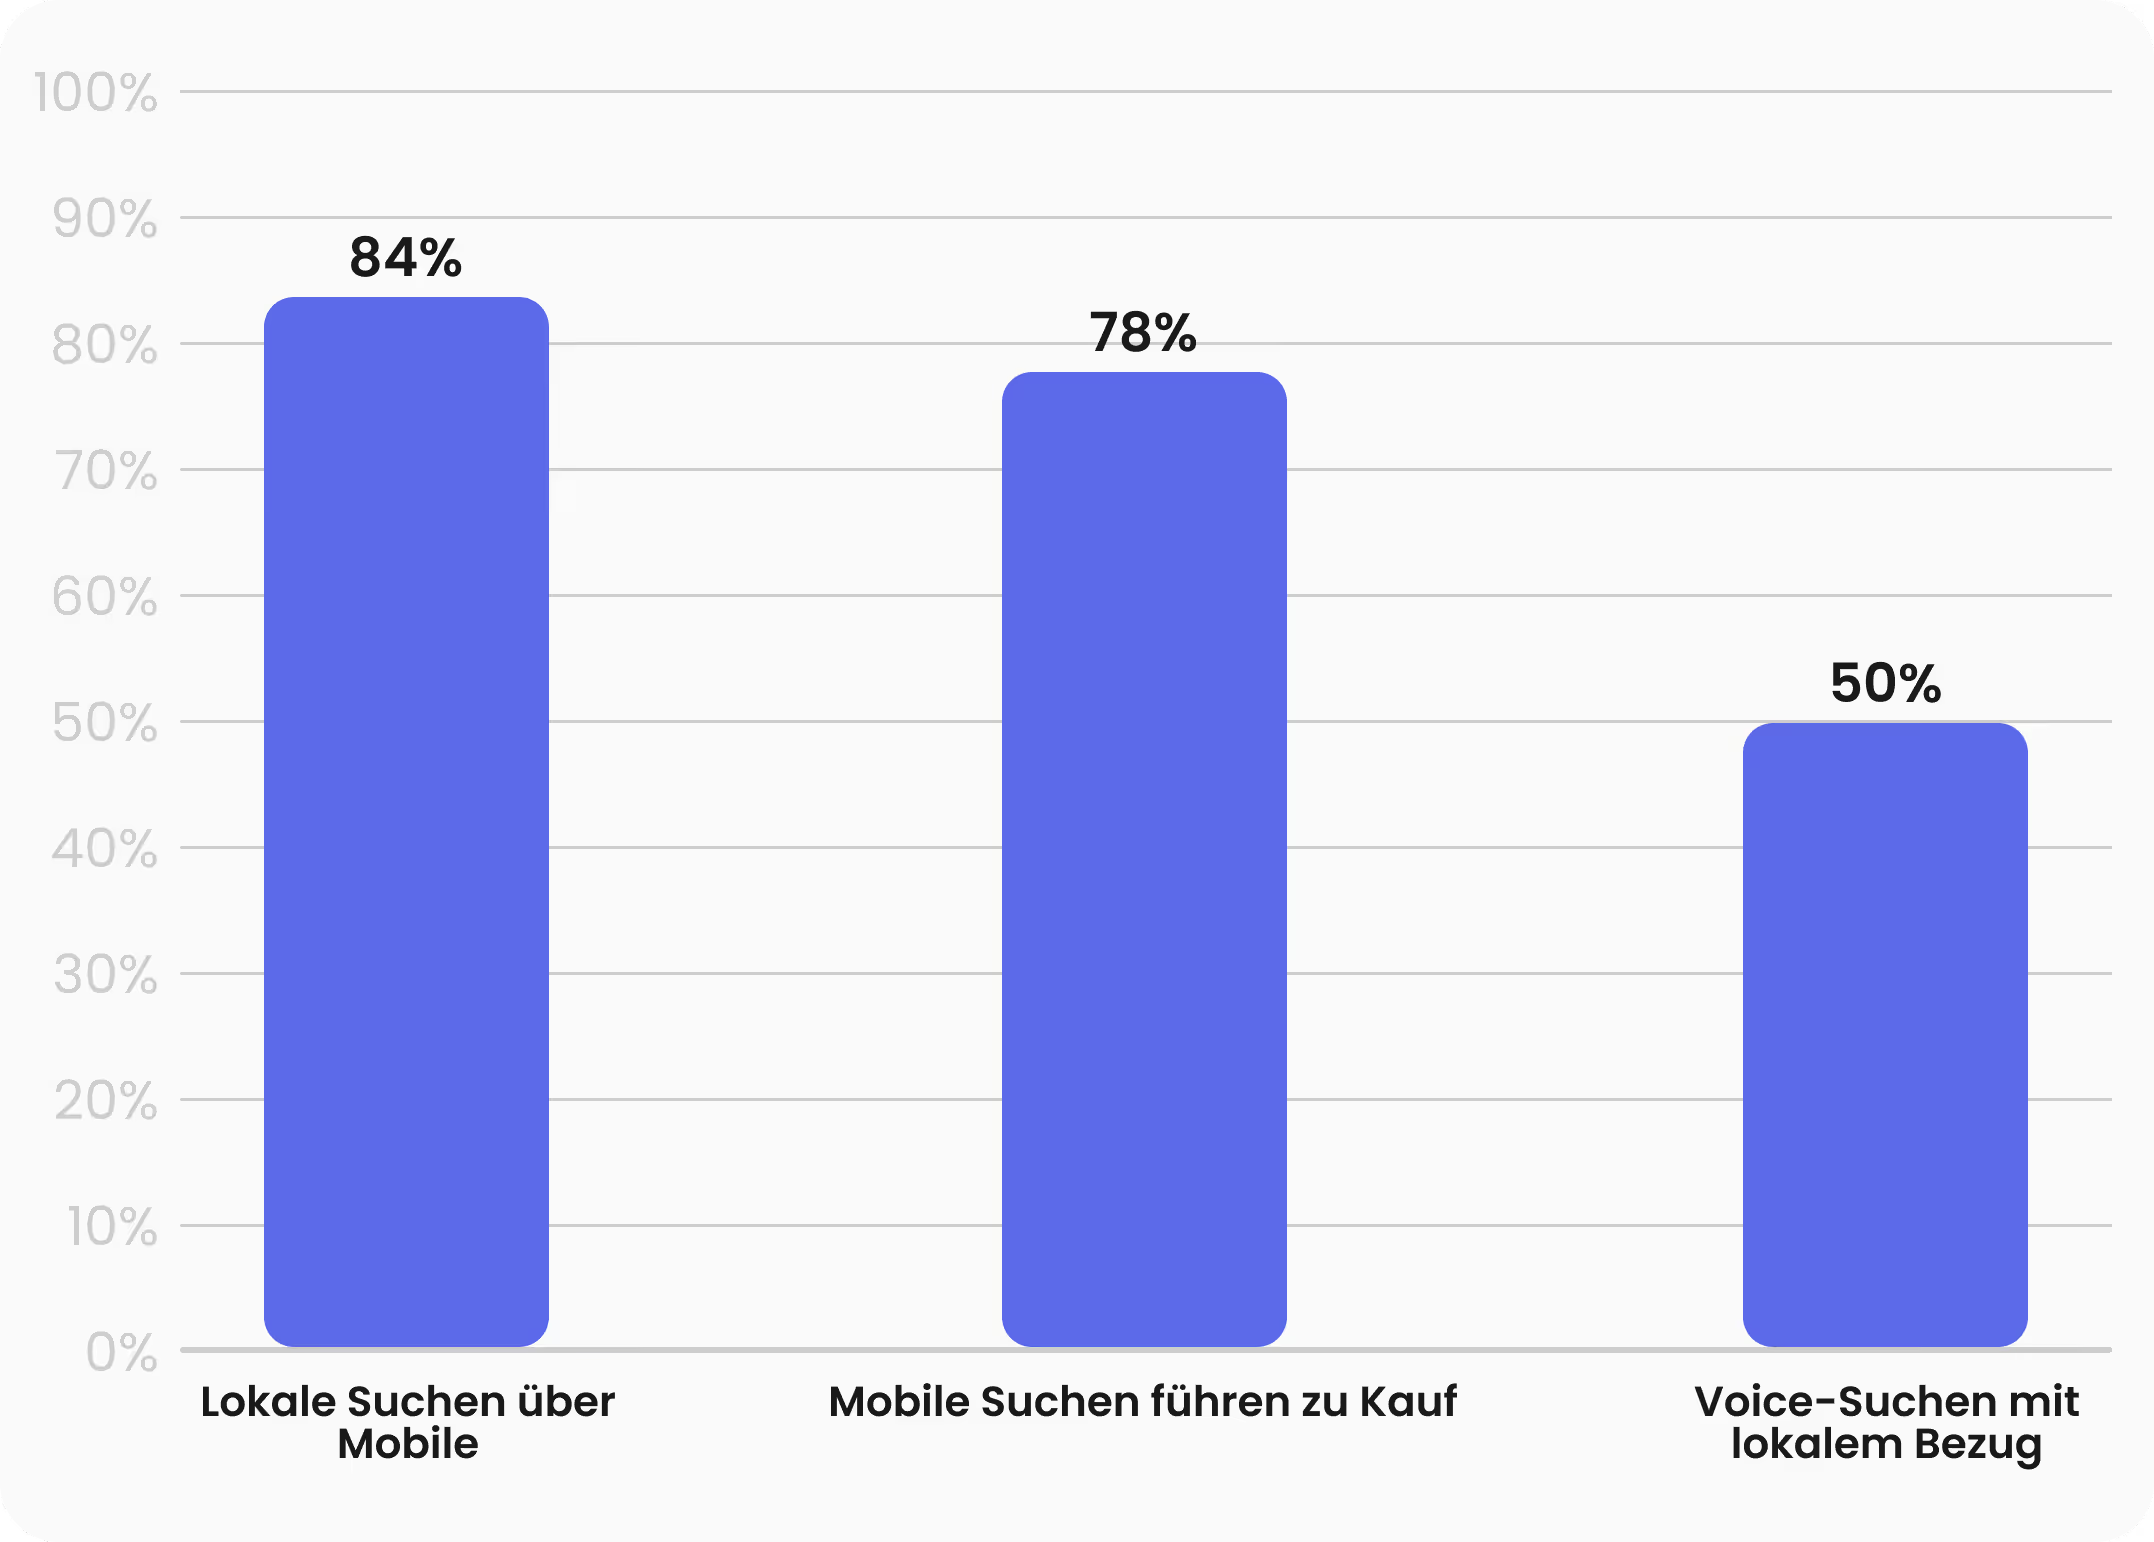
37) 84 % of local searches are performed on mobile devices. (SeoProfy)
38) 78 % of mobile local searches result in a purchase. (SeoProfy)
39) 82 % of smartphone users use search engines for local businesses. (WebFX)
40) Voice search queries are significantly more likely to have a local focus than text searches. (WebFX)
41) 50 % of all voice search queries have local search intent. (WebFX)
AI, ChatGPT & Local Search
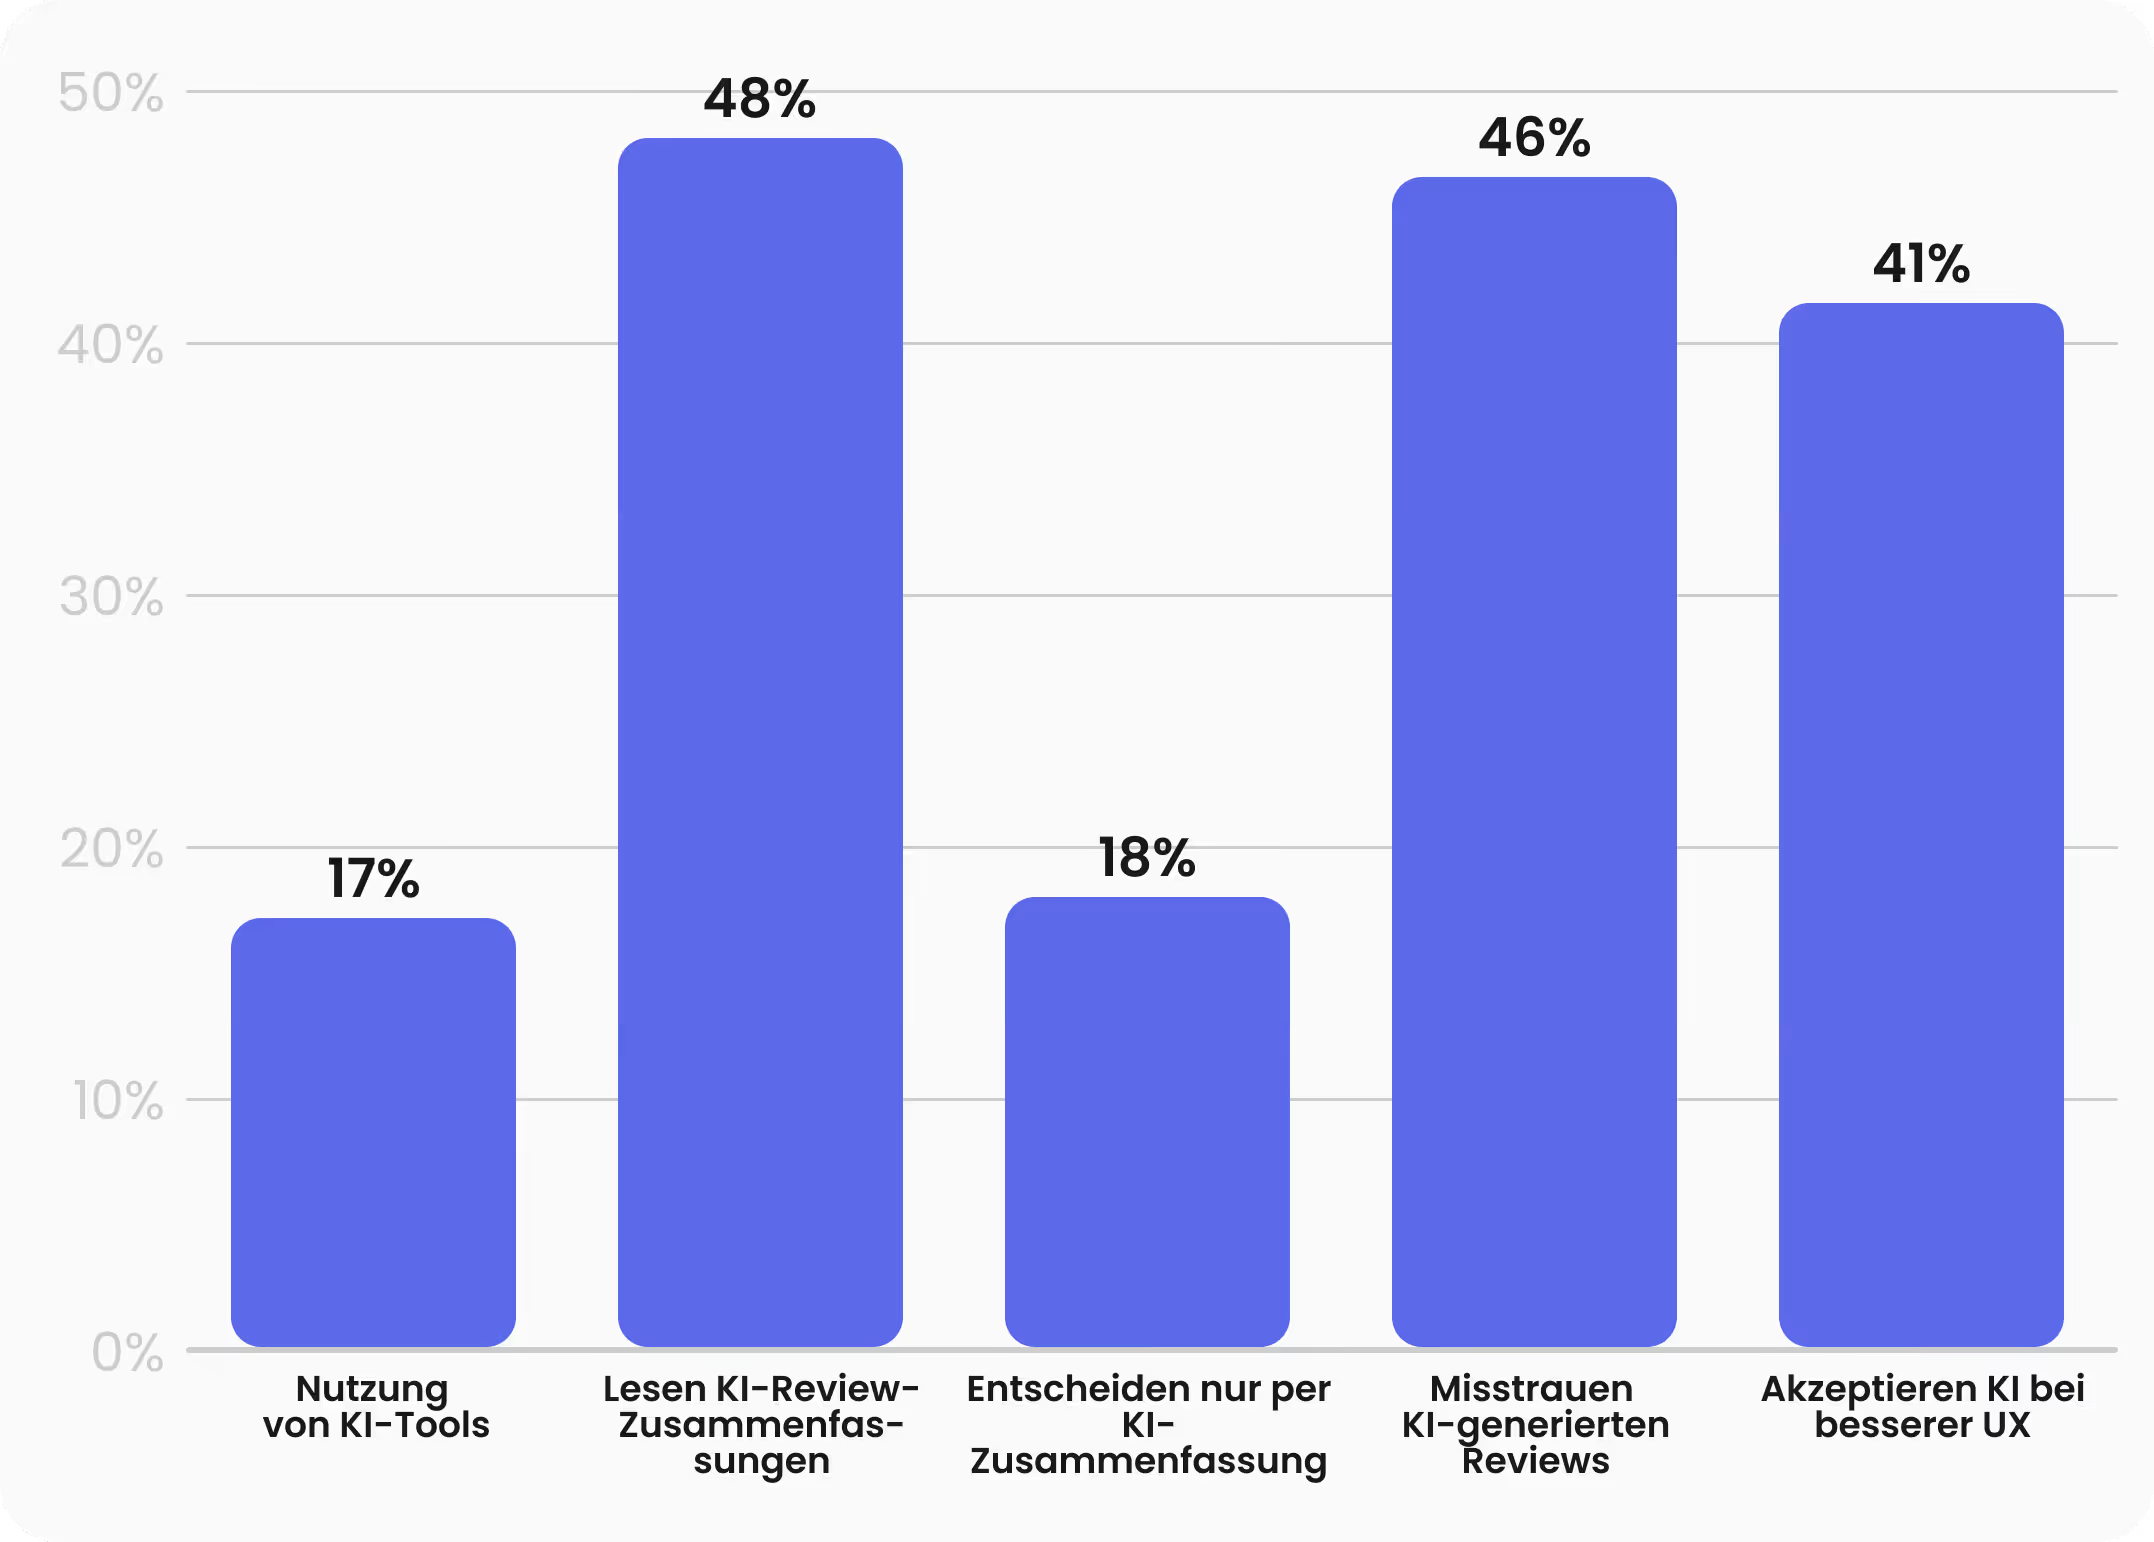
42) 17 % of consumers use AI tools like ChatGPT for search queries. (BrightLocal)
43) 48 % of users read AI-generated review summaries first. (BrightLocal)
44) 18 % of users would decide based solely on an AI summary. (BrightLocal)
45) 46 % distrust reviews that appear obviously AI-generated. (BrightLocal)
46) 41 % accept AI use if it improves the user experience. (BrightLocal)
Local SEO Market & Strategy
47) 58 % of businesses do not have a clear Local SEO strategy. (SeoProfy)
48) 40 % of small businesses outsource Local SEO tasks. (SeoProfy)
49) 79 % of marketers consider Local SEO to be highly effective. (WebFX)
50) 94 % of top brands pursue a local marketing strategy. (SeoProfy)
The market recognizes the effectiveness of Local SEO, but often fails to implement it systematically.